
Monitoring energy usage with smart plugs, Prometheus and Grafana
This post isn’t a detailed line-by-line tutorial on how to set up each individual piece of the setup as those types of guides tend to get out of date really easily, but if you know your way around Linux and the command line, then you can definitely replicate this setup on your own.
Over the past few years I’ve been interested in learning about how much energy my computing setup and home appliances use. I’ve used a simple digital energy meter before to get instantaneous readings, but that was not ideal for monitoring how an electrical appliance consumes power over a longer time period.
My friend bought a few smart plugs from athom.tech. After getting confirmation that they don’t suck, I went ahead and ordered some myself.
The smart plugs I bought were the EU style plug V3 variant. The shipping times in EU were reasonably fast, shipping in 9
days (and that included Christmas!).
The plugs ship with Tasmota pre-flashed. The plugs come with a small paper strip explaining the steps to take to connect the plug to your Wi-Fi network, and after that you can manage the plug in your browser.

Updating the firmware to the latest version is easy and doable in the web GUI with just a few clicks.

The software stack
My initial goal with these plugs was to visually monitor the power consumption of a few devices, such as my home server, router, workstation setup and the electric water heater.
The power meter data is collected to an existing Prometheus instance on my home server. If you’re not sure what Prometheus is, then think of it as a tool that periodically reads metrics from different sources, saves them to disk and allows you to later query and manipulate that information.
I run multiple instances of this tasmota-power-exporter solution on my server, one per plug, which get scraped once per second by the Prometheus instance. It is possible to also make the plugs themselves export these metrics, but I didn’t fancy building Tasmota firmware myself, yet.1
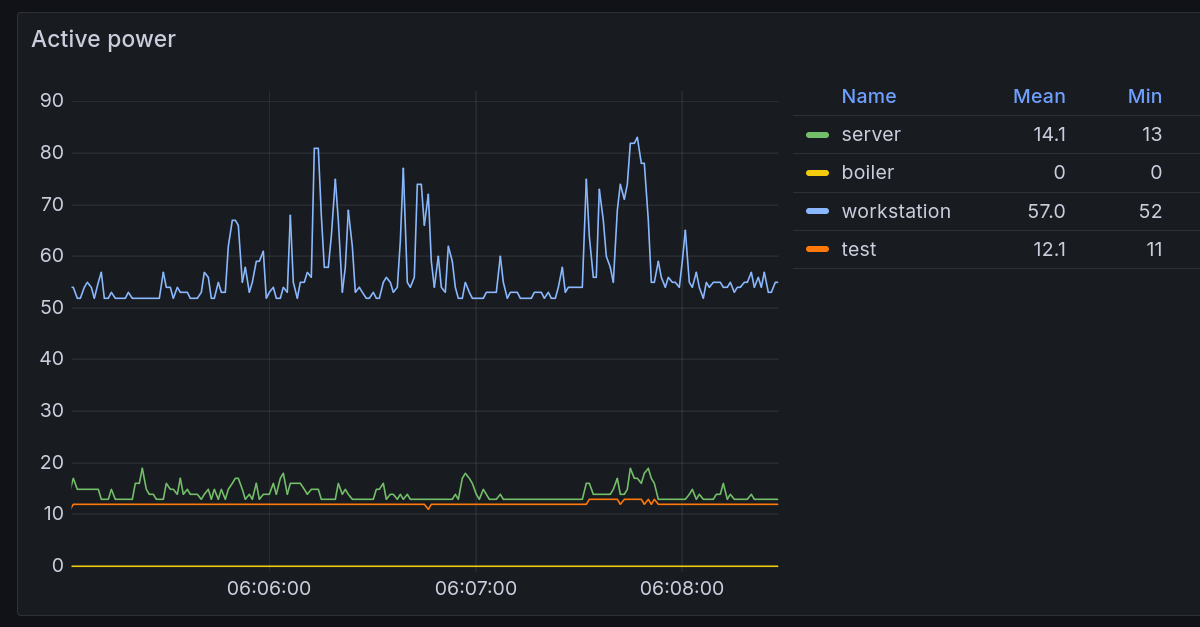
I already had a Grafana instance running on my home server, so I reused that to show a few basic graphs for the power meter setup.
Free tech tip: make sure to change the min step setting to 1 second to get the most detailed data points on your graphs.

Observations and findings
So, what have I learned after running this setup for almost 4 months?
Water heater
It shouldn’t come as a surprise that the electric water heater uses up the most power. The one we have is a 30L one, just enough for a quick shower or two or for washing a large load of dishes.
Typical power usage: 4.51 kWh/day.
Minimum observed: 0.56 kWh/day, happens usually when nobody is at home
Maximum observed: 11.1 kWh/day, a lot of washing and showering happened on that day

Home server setup
I run all my home server workloads off of a Zimaboard. One of its big selling points for me was its super low power consumption. When idling, the Zimaboard can use about 2 W, typical power usage with all my services running was about 7 W and the maximum power consumption was around 15 W.
The Zimaboard was actually using less power than my internet modem/router box (which is hot garbage by the way). The ISP-provided box used 12-14 W at all times, regardless if it was operating in router or bridge mode.


At one point I temporarily switched my home server setup back to the ASRock Deskmini X300, mainly because I added some latency-sensitive workloads onto my home server setup and the Zimaboard was a bit too weak for those.
One thing that became really obvious from the power meter is that the Deskmini idle power consumption is horrible in comparison to the Zimaboard, coming in at around 15-20 W. This might be in part because my Deskmini doesn’t seem to expose any lower CPU power states than C3 while the Zimaboard exposed C-states all the way down to C10. I could not find a way to expose lower C-states in UEFI settings or the Linux kernel. Based on a quick remark in this video I believe that it should be possible to drop ASRock a message and receive a custom BIOS that enables some extra features, but that seems even more unlikely for a consumer-grade device such as this one.

I’ve added a panel to my usual Prometheus node exporter Grafana view that shows the server setup power consumption alongside other metrics. Higher CPU activity is clearly visible on the power consumption graphs.

Voltage
The Tasmota plugs also report current voltage values. I graphed them just for fun, but noticed that there is a sort of seasonality to the values. During the usual peak power consumption hours the voltage drops across the board.

This seems like a candidate for testing anomaly detection, as shown in this great GitLab article. I’ve used this concept at work and it works reasonably well for some metrics.
In other cases the voltage drops were caused by running appliances that use a lot of power, such as the water heater, electric kettle, electric stove or the microwave.

During cooking with an electric stove, the on-off cycles were also noticeable on the voltage reading on all of the plugs.

Workstation
I have one plug that reports numbers for everything that’s connected to my home office setup: monitor, USB-C dock, monitor light bar and anything that might be charging on the table.
The power consumption of this setup varies a lot. Sometimes I do a longer home office stint. Sometimes I recharge various devices.
The typical power consumption of the whole setup while doing something on my computer is around 45-60 W, with peaks near 90-110 W. For an ultrawide monitor, USB-C dock and my laptop I think this is a pretty good result. I’ve had desktop PC-s that have used just as much power at idle, and in the olden days there were incandescent light bulbs that used up more electricity than this!

Typical power usage: 0.95 kWh/day.
Minimum observed: 0.07 kWh/day
Maximum observed: 1.52 kWh/day
Charging
These plugs are also great for observing the charging patterns of various devices.
A laptop or a power bank charges faster at the beginning, but the speed drops off as the battery gets more full. At one point trickle charging seems to kick in until the device is fully charged.

This pattern is similar on most devices that I charge. The battery on my e-bike seems to be an exception to the rule, with a slighly increasing power consumption throughout, and a faster drop at the end of the charging cycle.

0.5kWh of power consumed for 60km of range with the “Turbo” preset on the bike doesn’t sound bad at all. Half a cent per kilometer!
Stability
The stability of the smart plugs is usually fine, but there are frequent cases where certain plugs don’t report back in time with the statistics. This may be a Wi-Fi access point issue, but annoying nevertheless.
I’ve had to completely power cycle two plugs a few times because they dropped off from the network completely and would not come back. Again, could be the fault of my Wi-Fi AP.
Future ideas
The plugs also provide a way to turn the devices on and off over different API-s (even over HTTP!), which is something I’d like to utilize either using something like Home Assistant, or a simple script that toggles certain devices on and off based on the current electricity price.
I haven’t gotten around to this part yet, but from my research it seems that the necessary integrations exist for Home Assistant.
Closing thoughts
Overall, I’m very happy with this setup. I can get reliable measurements for all sorts of computing setups from now on, which will make judging the power efficiency of the devices I use much easier. No more guesswork!
If you enjoyed this post, then I highly recommend giving this FOSDEM 2024 talk by Florian Quèze a listen. The talk also goes into details about measuring the power consumption of various devices in the speakers’ home and observations that they’ve made.
-
This was pointed out to me by a fellow reader. Thank you! ↩︎
Subscribe to new posts via the RSS feed.
Not sure what RSS is, or how to get started? Check this guide!
You can reach me via e-mail or LinkedIn.
If you liked this post, consider sharing it!