Strangling your service with a Kubernetes misconfiguration
This is a quick story about a fun discovery that I made a while ago.
For legal reasons, all of this is made up and no such service ever existed.

Once upon a time, we had this Java service that handled all the backend work that you’d expect to occur for a product with a web interface. The service wasn’t the newest thing on the block and had seen dozens of developers work on it over many years.
At one point, it was moved to a Kubernetes cluster. That meant configuring all the bits and pieces. In YAML, of course.
A couple of years ago I joined the project and started work on it. Things were constantly on fire, so the fact that the service took anywhere from 5 to 15 minutes to deploy to the staging environment wasn’t something I focused on. After pushing a commit, the team either took a coffee break, went to play some table tennis or started work on something else while the pipeline did its job.
It didn’t help that running the service locally was hand-waved away as something that was too impractical to do by people who had been in the project longer than me, so the team simply relied on local tests and checking the staging environment after they pushed a change.
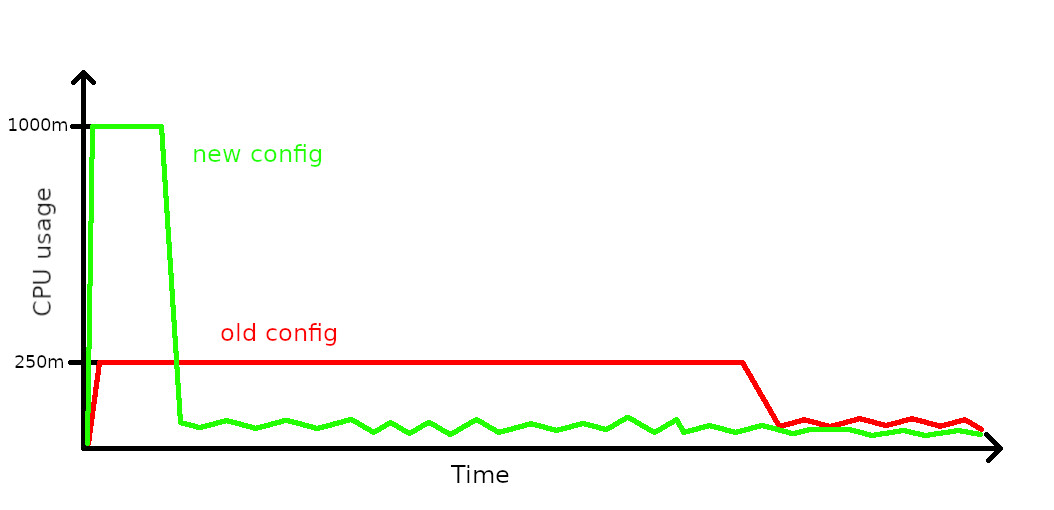
A year or so later, I had enough. The project wasn’t also constantly on fire, only occasionally, so I decided to take the time to dig into our CI pipeline configuration to see what is causing the pipeline to be so slow. My investigation lead to Kubernetes configuration, specifically the part where resource limits were configured. For whatever reason, I found that the service was allowed an absurdly low CPU allocation, measured in millicores.
I increased the limit to something sensible, such as 1 full CPU core. The result? The startup time of each pod took 30-40 seconds now, resulting in deployments that took 2 to 3 minutes max. This is an insane improvement over the old deployments that took up to 15 minutes regularly.
To go even faster. I tweaked the maxSurge property of the rolling update deployment
strategy to start up more new pods in parallel, further shortening the time that
it took to deploy the service. The only thing I had to keep in mind was the
number of database connections afforded to each pod and the maximum number of
connections offered by the database. Start up too many pods in parallel, and
you’ll find that your deployment fails due to the service exhausting the
available database connections.
Some time later I learned the reason behind such a CPU resource limit configuration. Apparently it’s a good practice to set your resource limits based on the average load that your service exhibits after it has properly started up. It does make sense, especially if you don’t want to have your Kubernetes nodes sit idle due to inefficient resource usage.
This example case shows that it’s a trade-off that you’ll have to take into consideration, especially if your service starts up quite slowly and not in mere seconds.
At the time of writing this post, the tweaked configuration is still up and running in production.
Subscribe to new posts via the RSS feed.
Not sure what RSS is, or how to get started? Check this guide!
You can reach me via e-mail or LinkedIn.
If you liked this post, consider sharing it!