Database optimization adventures on low-end hardware
I used to work on a short-term project a while ago where the goal was to visualize some metrics that were collected from a pretty fancy smart home setup. This data included power usage of various sections of the building, temperature sensors, water usage levels and more. The data itself was collected by a proprietary piece of software that sent this data to a MySQL database. My job was to understand the data, get useful values from the binary data and visualize it.
The hardware
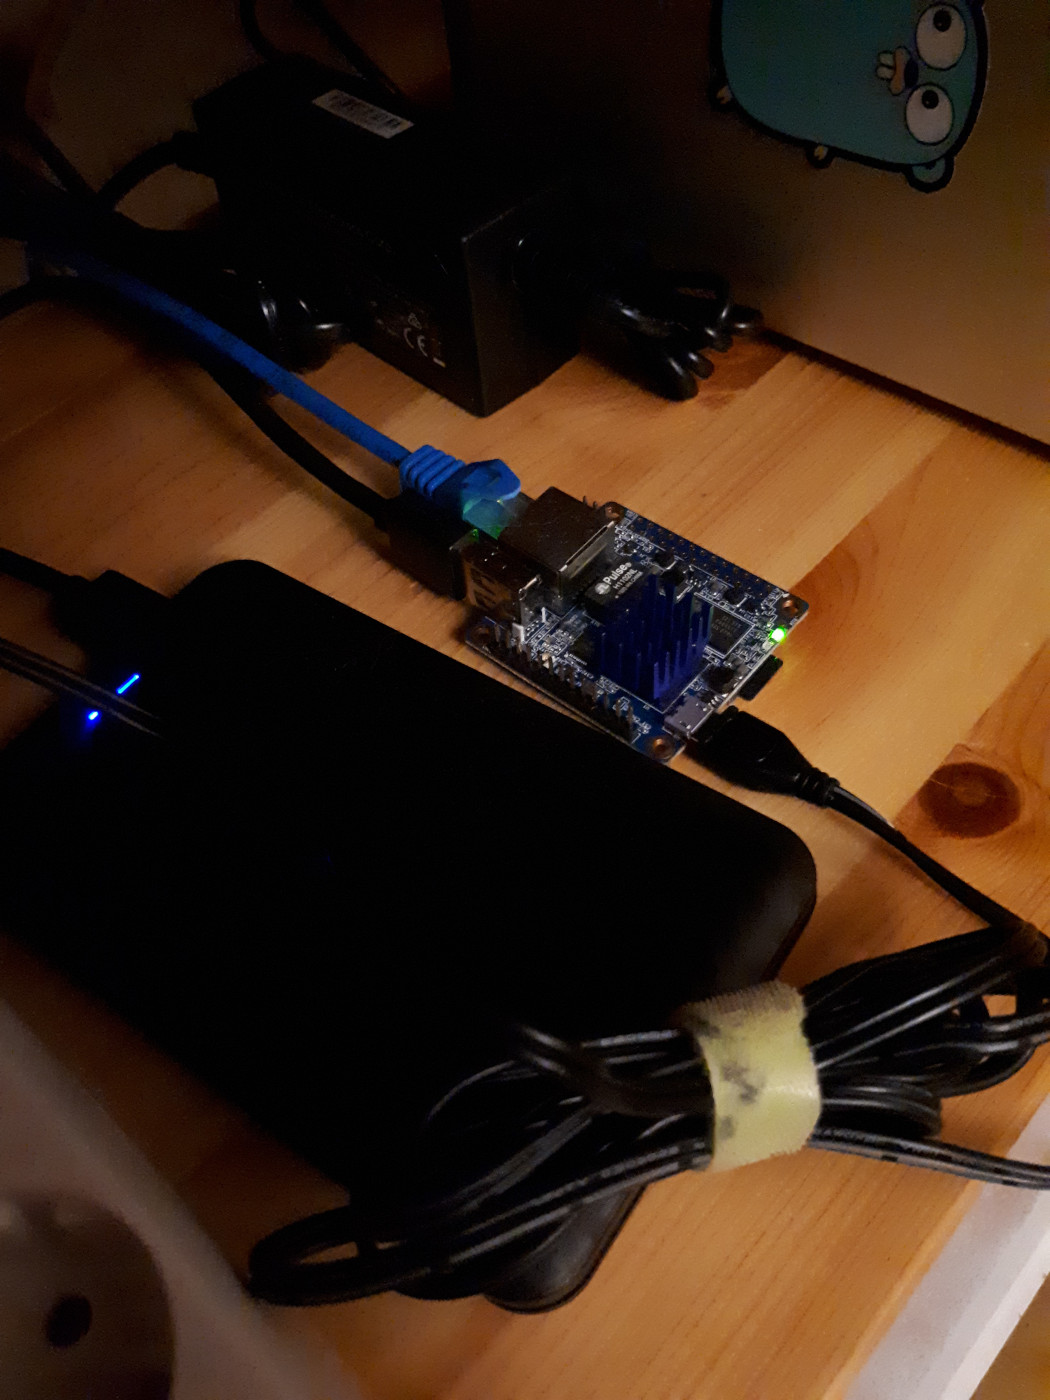
While testing out this solution, I started with an Orange Pi Zero that a good friend had given to me. You might remember this board from a previous adventure. This board boasts a whopping 4 ARM 32-bit CPU cores running at 1000MHz, 100 Mbps networking and one USB 2.0 port. The slow USB port means that the read speeds for any storage you attach to it will be capped out at 40 MB/s.
With all of this in mind, I still went ahead and built this monstrosity. I took a 480 GB Kingston SSD that was lying in a box and connected it to the board.
The workload
This server had two jobs: collect the incoming data from sensors to a MariaDB instance and visualize it using a tool like Grafana. The first part was OK, since the amount of incoming data was not that high and the SBC could handle it. However, I hit some roadblocks when trying to visualize it.
The first hurdle was to convert the binary values into something usable. Going by the documentation, I could figure out how to show signed and unsigned integer values correctly by utilizing some SQL magic that did the conversions more-or-less correctly. However, with other data types, such as floating-point values of varying precision and other fun formats, I could not use the same methods to perform the conversion.
The second hurdle was performance. The incoming data was put into one table, which would periodically get split up on a
month-by-month basis to avoid the table getting too big. Not a bad solution, but since I was planning on using Grafana,
having all the data in one table was the only sensible solution if I wanted to show data for previous months as well.
This meant that I had one big table with all the important data, plus some adjacent ones that provided details for the
sensor/meter type, its value type (integer, floating point, etc.) and more. Performing SELECT statements with a couple
of joins proved to be a headache: the queries would trigger a full table search, which was very painful on a system
where the maximum read speed of the SSD is 40 MB/s. Understandably, lookups on a database that was already at a couple
of gigabytes in size and growing would be slow even for shorter time spans (30 days).
These limitations meant that in its current state, the solution was pretty limited in functionality and very slow to use as well.
The solution
I soon learned that the company behind the hardware and software of this system provides a tool which can be used to connect to the database and read the collected data, with values converted properly and sensor/meter names provided as well. And to top it all off, this thing was written in Java!
I decided to dig around in the provided .jar file using IntelliJ IDEA and stumbled upon some interesting files. These files
corresponded to different data types, and also contained the logic that was used to convert the binary data to usable
values. I can only guess that this conversion was made with the goal of keeping the database size as small as possible,
or to just avoid users from using this data for other purposes using tools made by other companies.
There were still the performance issues to resolve. I looked into optimizing MySQL/MariaDB tables and queries and stumbled upon some useful tips and tricks. While I cannot remember the exact details, I did end up testing the different DB engines (InnoDB vs whatever they had previously), configuring various cache sizes and limits, indexes on various column types, investigating query plans and the performance benefits of denormalization.
And then it clicked.
What if I wrote a small Java service that would handle the data conversion and put all the data into one table that holds only the relevant data and has the correct set of indexes set up? The service would periodically check the main table that collected all the data, select the results, convert the value into something that a human can understand, and then insert it into a new table that is optimized for read performance.
After hours of work, I had this Java service up and running on the underpowered server and started testing this solution. Queries that would previously take minutes to run, would now finish within seconds. Even queries with a time window of 90+ days would still finish within 5 seconds. This improvement in performance is further amplified by the fact that Grafana is able to show multiple graphs at the same time, resulting in multiple queries running at the same time.
Deployment
The hardware that I tested this solution on was pretty neat and used up very little power. The total cost with the SSD included was roughly in the 100-150 euro range. However, it was decided that the deployment would be done on a more conventional machine.
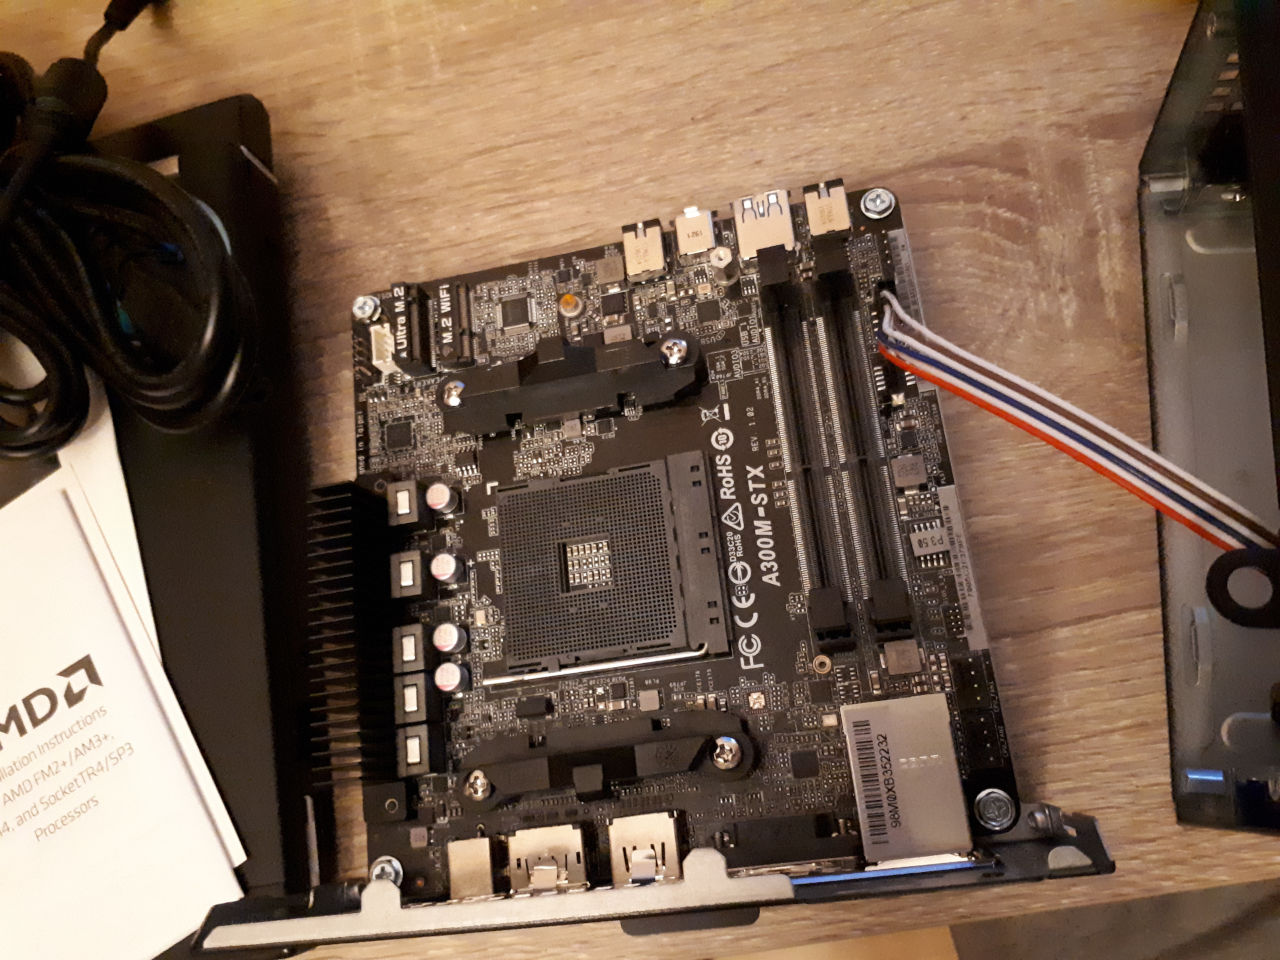
I went ahead and built a tiny PC based on the AsRock Deskmini A300. The build included a dual-core AMD Athlon APU (cut-down version of a Ryzen APU), 16 GB of DDR4 RAM because it cost just as much as an 8 GB DDR4 kit did at the time, one 120 GB SATA SSD for the OS, two 512GB Kingston A1000 NVMe SSD-s for the main storage (ZFS mirror) and a cheap 480 GB Kingston A400 SATA SSD for local backups. This whole build fit in a 500 euro budget and was a bit overkill for the purpose, but the performance that you could get out of this build was insane. And to top it all off, the server itself is very tiny and energy efficient, meaning that you could stick it pretty much anywhere, and it would still run happily while consuming less than 50 watts even under the most intense workloads.
The performance optimizations that I did were a must-have on the SBC that I did most of my testing on. On this new build, however, all the bottlenecks were lifted. The CPU probably had more processing power than 20 of the Orange Pi Zero boards combined, and the maximum read speeds on the crazy fast ZFS mirror were measured in gigabytes per second. Queries that took a second to run on the old setup were now done in the blink of an eye (or in other words, measured in milliseconds).
This deployment would probably last years without any intervention from anyone, assuming that the incoming data would not grow too fast. Unfortunately the solution itself did not find much use, so I could not test this theory out. The box itself is still happily running at the time of writing.
Lessons learned
The main reason that I am writing about this experience is the simple fact that it was a fantastic challenge to try to extract as much performance out of the Orange Pi Zero based server. Getting your queries from 30 seconds down to 0.3 seconds felt like a great achievement, plus I got to revisit some database related topics that I first learned about during my university days.
This experience also shows that even low-end hardware can achieve a lot if you are aware of its limitations and can work around them with a little bit of effort. After this project, I have played around with my homelab setup a lot and have finally settled on a solution that does not consume a lot of power, but can still run all the workloads that I want to run.
Subscribe to new posts via the RSS feed.
Not sure what RSS is, or how to get started? Check this guide!
You can reach me via e-mail or LinkedIn.
If you liked this post, consider sharing it!